
Page 13 - Advice Matters - Byfields Wealth May 24
P. 13
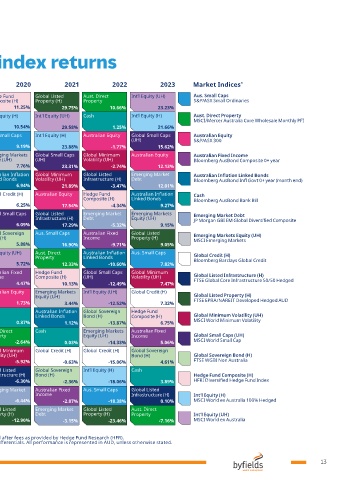
Mercer periodic table of annual index returns                           Click on an index in the legend below

                                                                         to view its trend through the decade.

 2014  2015  2016  2017  2018  2019  2020  2021  2022         2023       Market Indices   *

 Best  Global Listed   Global Minimum   Global Small Caps   Emerging Markets   Aust. Direct   Int'l Equity (UH)  Hedge Fund   Global Listed   Aust. Direct   Int’l Equity (UH)  Aus. Small Caps
                  Property (H)
                                                                         S&P/ASX Small Ordinaries
                                   Property
 Property
 Composite (H)
 Volatility (UH)
 (UH)
 Equity (UH)
 Property (H)
 23.34%  19.03%  13.76%  27.09%  9.68%  27.97%  11.25%  29.75%  10.66%  23.23%
 Global Listed   Aust. Direct   Global Listed   Int'l Equity (H)  Global Minimum   Global Small Caps   Int'l Equity (H)  Int'l Equity (UH)  Cash  Int’l Equity (H)  Aust. Direct Property
 Infrastructure (H)  Property  Infrastructure (H)  Volatility (UH)  (UH)  MSCI/Mercer Australia Core Wholesale Monthly PFI
 23.19%  12.72%  13.42%  20.02%  9.52%  26.97%  10.54%  29.58%  1.25%  21.66%
 Global Minimum   Global Small Caps   Aus. Small Caps  Aus. Small Caps  Australian Fixed   Int'l Equity (H)  Aus. Small Caps  Int'l Equity (H)  Australian Equity  Global Small Caps   Australian Equity
 Volatility (UH)  (UH)  Income                     (UH)                  S&P/ASX 300
 22.51%  12.61%  13.15%  20.02%  4.54%  26.81%  9.19%  23.88%  -1.77%  15.62%
 Int'l Equity (UH)  Int'l Equity (UH)  Australian Equity  Global Listed   Emerging Market   Global Listed   Emerging Markets   Global Small Caps   Global Minimum   Australian Equity  Australian Fixed Income
 Infrastructure (H)  Debt  Infrastructure (H)  Equity (UH)  (UH)  Volatility (UH)  Bloomberg AusBond Composite 0+ year
 15.01%  11.80%  11.77%  15.95%  4.20%  24.51%  7.76%  23.31%  -2.74%  12.13%
 Australian Inflation   Aus. Small Caps  Emerging Markets   Global Small Caps   Australian Inflation   Global Minimum   Australian Inflation   Global Minimum   Global Listed   Emerging Market   Australian Inflation Linked Bonds
 Linked Bonds  Equity (UH)  (UH)  Linked Bonds  Volatility (UH)  Linked Bonds  Volatility (UH)  Infrastructure (H)  Debt  Bloomberg AusBond Infl Govt 0+ year (month end)
 14.16%  10.16%  11.69%  14.04%  3.56%  24.15%  6.94%  21.89%  -3.47%  12.01%
 Int'l Equity (H)  Global Listed   Aust. Direct   Int'l Equity (UH)  Global Sovereign   Australian Equity  Global Credit (H)  Australian Equity  Hedge Fund   Australian Inflation   Cash
 Property (H)  Property  Bond (H)  Composite (H)   Linked Bonds          Bloomberg AusBond Bank Bill
 12.55%  5.17%  11.10%  13.38%  2.47%  23.77%  6.25%  17.54%  -4.34%  9.27%
 Global Small Caps   Int'l Equity (H)  Emerging Market   Aust. Direct   Cash  Global Listed   Global Small Caps   Global Listed   Emerging Market   Emerging Markets   Emerging Market Debt
 (UH)  Debt  Property  Property (H)  (UH)  Infrastructure (H)  Debt  Equity (UH)  JP Morgan GBI EM Global Diversified Composite
 11.86%  3.83%  10.44%  12.84%  1.92%  22.29%  6.09%  17.29%  -5.32%  9.15%
 Global Sovereign   Global Sovereign   Int'l Equity (H)  Australian Equity  Int'l Equity (UH)  Aus. Small Caps  Global Sovereign   Aus. Small Caps  Australian Fixed   Global Listed   Emerging Markets Equity (UH)
 Bond (H)  Bond (H)  Bond (H)      Income          Property (H)          MSCI Emerging Markets
 11.16%  3.61%  10.32%  11.94%  1.52%  21.36%  5.88%  16.90%  -9.71%  9.05%
 Australian Fixed   Australian Equity  Global Minimum   Hedge Fund   Global Listed   Emerging Markets   Int'l Equity (UH)  Aust. Direct   Australian Inflation   Aus. Small Caps  Global Credit (H)
 Income  Volatility (UH)  Composite (H)  Infrastructure (H)  Equity (UH)  Property  Linked Bonds  Bloomberg Barclays Global Credit
 9.81%  2.80%  8.68%  9.32%  -0.67%  18.60%  5.72%  12.33%  -10.60%  7.82%
 Global Credit (H)  Australian Fixed   Global Credit (H)  Global Minimum   Global Credit (H)  Emerging Market   Australian Fixed   Hedge Fund   Global Small Caps   Global Minimum   Global Listed Infrastructure (H)
 Income  Volatility (UH)  Debt  Income  Composite (H)  (UH)  Volatility (UH)  FTSE Global Core Infrastructure 50/50 Hedged
 9.26%  2.59%  8.50%  9.28%  -1.00%  13.64%  4.47%  10.13%  -12.49%  7.47%
 Aust. Direct   Cash  Int'l Equity (UH)  Global Listed   Global Listed   Global Credit (H)  Australian Equity  Emerging Markets   Int’l Equity (UH)  Global Credit (H)
 Property  Property (H)  Property (H)  Equity (UH)                       Global Listed Property (H)
 9.22%  2.33%  7.90%  9.24%  -3.03%  10.93%  1.73%  3.44%  -12.52%  7.32%  FTSE EPRA/NAREIT Developed Hedged AUD
 Emerging Markets   Global Credit (H)  Hedge Fund   Emerging Market   Australian Equity  Hedge Fund   Cash  Australian Inflation   Global Sovereign   Hedge Fund
 Equity (UH)  Composite (H)  Debt  Composite (H)  Linked Bonds  Bond (H)  Composite (H)  Global Minimum Volatility (UH)
 6.93%  2.03%  7.08%  6.66%  -3.06%  9.64%  0.37%  1.12%  -13.87%  6.75%  MSCI World Minimum Volatility
 Hedge Fund   Australian Inflation   Global Listed   Global Credit (H)  Global Small Caps   Australian Inflation   Aust. Direct   Cash  Emerging Markets   Australian Fixed
 Composite (H)  Linked Bonds  Property (H)  (UH)  Linked Bonds  Property  Equity (UH)  Income  Global Small Caps (UH)
 5.50%  1.60%  6.91%  6.50%  -3.88%  8.48%  -2.64%  0.03%  -14.33%  5.06%  MSCI World Small Cap
 Australian Equity  Hedge Fund   Global Sovereign   Australian Inflation   Hedge Fund   Australian Fixed   Global Minimum   Global Credit (H)  Global Credit (H)  Global Sovereign
 Composite (H)  Bond (H)  Linked Bonds  Composite (H)  Income  Volatility (UH)  Bond (H)  Global Sovereign Bond (H)
 5.30%  0.94%  5.05%  3.73%  -4.90%  7.26%  -5.92%  -0.63%  -15.06%  4.61%  FTSE WGBI Non Australia
 Emerging Market   Global Listed   Australian Fixed   Australian Fixed   Emerging Markets   Global Sovereign   Global Listed   Global Sovereign   Int’l Equity (H)  Cash
 Debt  Infrastructure (H)  Income  Income  Equity (UH)  Bond (H)  Infrastructure (H)  Bond (H)  Hedge Fund Composite (H)
 3.07%  -1.81%  2.91%  3.66%  -5.08%  6.60%  -6.30%  -2.36%  -18.06%  3.89%  HFRI Diversified Hedge Fund Index
 Cash  Emerging Markets   Cash  Global Sovereign   Int'l Equity (H)  Aust. Direct   Emerging Market   Australian Fixed   Aus. Small Caps  Global Listed
 Equity (UH)  Bond (H)  Property  Debt  Income     Infrastructure (H)    Int’l Equity (H)
                                           -18.38%
                           -2.87%
 2.69%  -4.30%  2.07%  2.78%  -7.58%  5.62%  Global Listed  -6.44%  Emerging Market   Global Listed   Aust. Direct   0.10%  MSCI World ex Australia 100% Hedged
 Worst  Aus. Small Caps  Emerging Market   Australian Inflation   Cash  1.75%  Aus. Small Caps  Cash  1.50%  Property (H) -12.90%  Debt  -3.15%  Property (H) -23.46%  Property  -7.16%  Int’l Equity (UH)
 Debt
 Linked Bonds
                                                                         MSCI World ex Australia
 -3.81%
 -8.67%
 -4.30%
 1.19%
 UH = Unhedged returns H = Hedged returns  *   All indices are gross of fees with the exception of Hedge Funds which are reported after fees as provided by Hedge Fund Research (HFR).   » Click here for important notices.
 Data sources: Refinitiv Datastream; MSCI; HFR  For Hedge Funds the hedge pickup is approximated using 3 month interest rate differentials. All performance is represented in AUD, unless otherwise stated.
                                                                                                                      13