
Page 15 - Best of the Best | The Only Prescription for Healthy Finances
P. 15
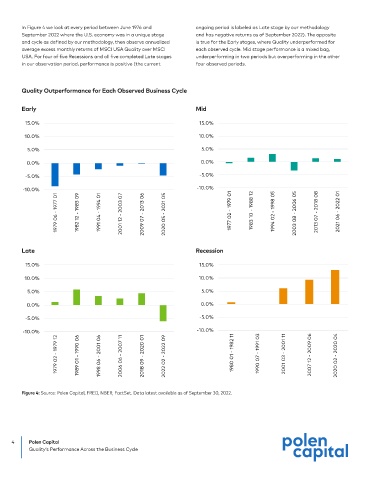
In Figure 4 we look at every period between June 1976 and   ongoing period is labeled as Late stage by our methodology
        September 2022 where the U.S. economy was in a unique stage   and has negative returns as of September 2022). The opposite
        and cycle as defined by our methodology, then observe annualized   is true for the Early stages, where Quality underperformed for
        average excess monthly returns of MSCI USA Quality over MSCI   each observed cycle. Mid stage performance is a mixed bag,
        USA. For four of five Recessions and all five completed Late stages   underperforming in two periods but overperforming in the other
        in our observation period, performance is positive (the current   four observed periods.


        Quality Outperformance for Each Observed Business Cycle


        Early                                                     Mid

         15.0%                                                     15.0%

         10.0%                                                     10.0%
          5.0%                                                      5.0%

          0.0%                                                     0.0%

         -5.0%                                                     -5.0%
         -10.0%                                                   -10.0%
                    1979 06 - 1977 01  1982 12 - 1983 09  1991 04 - 1994 01  2001 12 - 2003 07  2009 07 - 2013 06  2020 05 - 2021 05  1977 02 - 1979 01  1983 10 - 1988 12  1994 02 - 1998 05  2003 08 - 2006 05  2013 07 - 2018 08  2021 06 - 2022 01


        Late                                                      Recession

         15.0%                                                     15.0%

         10.0%                                                     10.0%

          5.0%                                                      5.0%
          0.0%                                                     0.0%

         -5.0%                                                     -5.0%

         -10.0%                                                   -10.0%
                    1979 02 - 1979 12  1989 01 - 1990 06  1998 06 - 2001 06  2006 06 - 2007 11  2018 09 - 2020 01  2022 02 - 2022 09  1980 01 - 1982 11  1990 07 - 1991 03  2001 03 - 2001 11  2007 12 - 2009 06  2020 02 - 2020 04


        Figure 4: Source: Polen Capital, FRED, NBER, FactSet. Data latest available as of September 30, 2022.


     4     Polen Capital
           Quality’s Performance Across the Business Cycle