
Page 14 - Best of the Best | The Only Prescription for Healthy Finances
P. 14
define the period as a recession, we assign the label using the Results
next highest score from the output of our clustering algorithm.
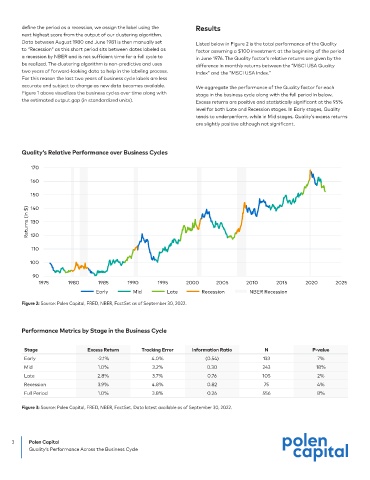
Data between August 1980 and June 1981 is then manually set Listed below in Figure 2 is the total performance of the Quality
to “Recession” as this short period sits between dates labeled as factor assuming a $100 investment at the beginning of the period
a recession by NBER and is not sufficient time for a full cycle to in June 1976. The Quality factor’s relative returns are given by the
be realized. The clustering algorithm is non-predictive and uses difference in monthly returns between the “MSCI USA Quality
two years of forward-looking data to help in the labeling process. Index” and the “MSCI USA Index.”
For this reason the last two years of business cycle labels are less
accurate and subject to change as new data becomes available. We aggregate the performance of the Quality factor for each
Figure 1 above visualizes the business cycles over time along with stage in the business cycle along with the full period in below.
the estimated output gap (in standardized units). Excess returns are positive and statistically significant at the 95%
level for both Late and Recession stages. In Early stages, Quality
tends to underperform, while in Mid stages, Quality’s excess returns
are slightly positive although not significant.
Quality’s Relative Performance over Business Cycles
170
160
150
Returns (in $) 140
130
120
110
100
90
1975 1980 1985 1990 1995 2000 2005 2010 2015 2020 2025
Early Mid Late Recession NBER Recession
Figure 2: Source: Polen Capital, FRED, NBER, FactSet as of September 30, 2022.
Performance Metrics by Stage in the Business Cycle
Stage Excess Return Tracking Error Information Ratio N P-value
Early -2.1% 4.0% (0.54) 133 7%
Mid 1.0% 3.2% 0.30 243 18%
Late 2.8% 3.7% 0.76 105 2%
Recession 3.9% 4.8% 0.82 75 4%
Full Period 1.0% 3.8% 0.26 556 8%
Figure 3: Source: Polen Capital, FRED, NBER, FactSet. Data latest available as of September 30, 2022.
3 Polen Capital
Quality’s Performance Across the Business Cycle