
Page 13 - Best of the Best | The Only Prescription for Healthy Finances
P. 13
Data & Methodology Business Cycle
For our analysis, we use the historical performance of the Quality We break up the business cycle into four stages:
factor and the historical stages of the business cycle. We constrain
our analysis to the U.S. — where there is the most readily available • Early: Economic output recovers following Recessions where
and complete data, courtesy of FRED. All results listed in this activity has contracted. Typically low interest rates and
2
report are computed between June 1976 and September 2022. stimulative policy.
Data from FRED, which is used to label stages of the business • Mid: Moderate growth in the economy, stimulative policy
cycle, is available beginning in June 1976, marking the start of pulls back.
the analysis. • Late: Growth in the economy begins to slow as its activity
comes to a peak.
Quality • Recession: Economic activity declines.
The Quality factor generally refers to securities with robust We label the stages of the business cycles by imitating an analysis
4
financials, consistent growth, and stable earnings. However, the from BlackRock. We use a clustering algorithm that groups
actual implementation of these ideas varies depending on the economically similar periods together and assigns four scores for
index, fund, or study. For this analysis, we measure Quality as the each stage. These scores are similar to a probability that a period
difference between the monthly returns of the “MSCI USA Quality is in a specific stage. For each period we take the output from
Index” and the “MSCI USA Index.” MSCI’s quality index “aims to the algorithm and label periods, using the stage with the highest
capture the performance of quality growth stocks by identifying score. Then we adjust these labels, using the following overrides.
stocks with high quality scores based on three main fundamental All periods defined as a recession by NBER (National Bureau of
variables: high return on equity (ROE), stable year-over-year Economic Reasearch) are labeled as “Recession.” Where previously
earnings growth, and low financial leverage.” the algorithm had assigned the “Recession” label and NBER does
3
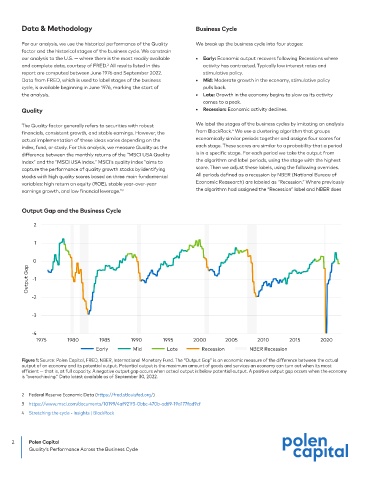
Output Gap and the Business Cycle
2
1
0
Output Gap -1
-2
-3
-4
1975 1980 1985 1990 1995 2000 2005 2010 2015 2020
Early Mid Late Recession NBER Recession
Figure 1: Source: Polen Capital, FRED, NBER, International Monetary Fund. The “Output Gap” is an economic measure of the difference between the actual
output of an economy and its potential output. Potential output is the maximum amount of goods and services an economy can turn out when its most
efficient — that is, at full capacity. A negative output gap occurs when actual output is below potential output. A positive output gap occurs when the economy
is “overachieving.” Data latest available as of September 30, 2022.
2 Federal Reserve Economic Data (https://fred.stlouisfed.org/)
3 https://www.msci.com/documents/10199/4af921f5-0bbc-470b-ad69-19a177fad9cf
4 Stretching the cycle - Insights | BlackRock
2 Polen Capital
Quality’s Performance Across the Business Cycle